-
Bug
-
Resolution: Fixed
-
 Medium
-
8.12.3, 8.14.0, 8.17.0, 8.13.11, 9.4.10, 9.12.15
-
8.12
-
31
-
Severity 2 - Major
-
75
-
Issue Summary
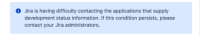
The development status summary panel is timing out when under heavy load even if data is available
Steps to Reproduce
- Connect a DVCS integration (Bitbucket, Gitlab or Github) with a linked issue
- Open 30+ tabs that auto-refresh (can use http://www.dummysoftware.com/easy-auto-refresh/?ref=chrome for this)
- In a separate browser open that same issue and refresh a few times until you see an error message about timeout or failure to load under the dev panel:

The following exception is thrown into logs:
2021-06-09 15:02:19,323+0100 http-nio-2990-exec-218 WARN admin 902x36691x25 eeeqnf 127.0.0.1 /rest/dev-status/1.0/issue/summary [c.a.j.p.devstatus.provider.DefaultCoordinator] GitLab (timeout after 5000ms, cached data returned)
There’s only 15 threads max that can fetch DVCS data at a time so this is causing contention:
   this.dvcsDataFetcherExecutor = ThreadPool.builder()
                .name("dvcs." + dvcsType())
                .maxThreads(15)
                .boundedQueue(QUEUE_SIZE)
                .build();
and the call to timeout. Note that increasing the timeout will not help here.
Expected Results
DVCS data related to the issue should load in the Dev Panel.
Actual Results
Data is not loaded into the dev panel which should return either the cached existing data or the new one stored into DB after soft or hard sync.
Workaround
Currently there is no known workaround for this behavior. A workaround will be added here when available

- relates to
-
JRASERVER-70678 As a Jira Admin, I would like to add an index by ISSUE_ID column on the table moved_issue_key
- Gathering Interest
- links to